Eco-friendly logistics means moving goods with lower carbon and pollutant intensity across transport, warehousing, packaging, and reverse flows, without sacrificing cost or service. Start now with four moves: optimize routing to cut empty miles, consolidate loads to raise utilization, retrofit warehouse lighting and controls for fast payback, and stand up an emissions inventory using SmartWay or GHG Protocol boundaries. Success looks like falling grams of CO2 per ton-mile and shrinking empty-mile percentage, tracked quarter over quarter, while cost per shipment holds steady or improves.
TL;DR:
- Prioritize load consolidation and route optimization to rapidly reduce emissions and empty miles without high capital costs.
- Focus on warehouse lighting and control upgrades that deliver quick energy savings, exemplified by a 41% electricity reduction at a Prologis facility.
- Use standardized frameworks like SmartWay or GHG Protocol to ensure consistent, comparable emission measurement over time.
- Implement a phased roadmap including baseline data collection, targeted pilots, verification, and continuous monitoring to avoid stalled initiatives.
- Align fleet electrification with depot readiness and energy infrastructure, starting with predictable routes to prevent delays and maximize benefits.
Table of Contents
- What Does Eco-Friendly Logistics Actually Cover?
- Which Operational Tactics Cut Emissions Fastest?
- How Do Warehouses Become More Energy Efficient?
- What Frameworks Should You Use to Measure Emissions?
- How Should Fleets Sequence Electrification and Alternative Fuels?
- How Can Data Sharing Reduce Empty Miles?
- What Does a Realistic Implementation Roadmap Look Like?
- What Are the Biggest Barriers to Going Green?
- What Do Logistics Teams Actually Get Wrong Here?
- How Worldwideexpress Supports Your Sustainability Roadmap
- Sources
- FAQ
What Does Eco-Friendly Logistics Actually Cover?
Eco-friendly logistics spans four operational layers: transportation (trucking, ocean, air, rail), warehousing and distribution centers, packaging design, and reverse logistics for returns and end-of-life materials. It also reaches upstream into fuel production and electricity sourcing, since a truck’s tailpipe emissions are only part of its footprint.
The business case is straightforward. Fuel and energy are among the largest controllable line items in freight, so efficiency gains show up directly on the income statement. Freight movement is also a major source of NOx, particulate matter, and CO2, which means the same operational changes that cut climate impact often improve local air quality near ports, warehouses, and distribution hubs. Retailers and manufacturers increasingly ask suppliers for emissions data before signing contracts, and several jurisdictions now require corporate carbon disclosure.
Two categories of metrics matter here, and they are not interchangeable:
- Climate metrics like CO2 and CO2 equivalent, which track long-term global warming contribution.
- Local air-quality metrics like NOx, particulate matter, and black carbon, which affect communities near distribution centers and truck corridors.
A fleet running cleaner diesel engines might improve NOx and PM without denting CO2 much. Both numbers belong in your reporting.
Which Operational Tactics Cut Emissions Fastest?
Not every green initiative delivers equal returns. This ranking reflects speed of implementation and typical payback, based on what logistics teams can act on without waiting for capital projects to clear approval.
- Route optimization and dynamic routing. Software-driven routing that accounts for traffic, delivery windows, and driver hours reduces miles driven per stop. The prerequisite is clean address and time-window data; garbage inputs produce garbage routes no matter how good the algorithm is.
- Load consolidation. Combining partial shipments into fewer, fuller trucks or containers is often the single highest-leverage move available, because it attacks empty miles and per-unit fuel burn simultaneously. Hub-based consolidation works for high-volume lanes; hubless, carrier-coordinated consolidation fits fragmented networks better. Freight consolidation also tends to lower cost per shipment, which makes it an easy sell to finance.
- Modal shift. Moving freight from truck-only to rail or intermodal on long-haul lanes cuts emissions per ton-mile substantially on suitable corridors. It works best where transit-time flexibility exists; time-critical freight usually stays on trucks. Reviewing freight transportation modes lane by lane surfaces where the swap makes sense.
- Load and container utilization. Better cube utilization in trailers and ocean containers, through improved packing algorithms or packaging redesign, reduces the number of moves needed for the same volume of goods.
- Reverse logistics and circular packaging. Redesigning returns flows and packaging materials reduces both waste and the extra transportation returns generate.
Pro Tip: Run consolidation and route optimization together before touching modal shift. Fixing utilization first means you are shifting fewer, fuller loads onto rail or intermodal, which multiplies the emissions benefit instead of just relocating waste.
How Do Warehouses Become More Energy Efficient?
Facilities are often the fastest place to show measurable progress, because the paybacks are shorter and easier to defend to finance teams than fleet investments.
- Lighting and controls. Swapping high-bay fluorescent or metal halide fixtures for LEDs with occupancy sensors is usually the highest-ROI project available to a warehouse operator.
- Refrigeration and HVAC. Cold-storage and climate-controlled facilities should treat energy procurement as an operations problem, not just a facilities line item, renegotiating rate structures and demand-response participation alongside equipment upgrades.
- Layout and racking. Reconfiguring racking and pick paths to shorten travel distance cuts forklift energy use and labor time in the same move.
- Financing tenant improvements. Tenants in leased facilities can often negotiate tenant improvement allowances that cover lighting and control upgrades, and utility rebate programs frequently offset a meaningful share of the remaining cost.
A DOE-tracked retrofit at a Prologis distribution center delivered a 41% reduction in facility electricity use after a lighting and controls upgrade. That single data point is worth bringing into any capital request. Coordination between landlord and tenant matters here: whoever controls the capital budget usually controls the timeline, so getting both parties aligned early avoids stalled projects.
What Frameworks Should You Use to Measure Emissions?
Measurement only matters if it is a comparable year over year and defensible to a customer or auditor. Three reference points cover most freight sustainability reporting needs.
- EPA SmartWay provides mode-specific emission factors and a structured way to benchmark carrier and shipper performance, and supports the GLEC framework for consistency.
- GLEC (Global Logistics Emissions Council) framework standardizes how companies calculate and report logistics emissions across modes, which matters when your carriers and customers are using different tools.
- GHG Protocol sets the accounting rules for Scope 1, 2, and 3 emissions, which is where most freight emissions land for shippers who don’t own their trucks.
Core KPIs worth tracking on a rolling basis:
| Metric | What it measures | Why it matters |
|---|---|---|
| Grams CO2 per mile | Vehicle-level fuel efficiency | Baseline comparison across trucks or routes |
| Grams CO2 per ton-mile | Efficiency adjusted for payload | True efficiency, since a full truck beats an empty one on this metric |
| NOx and PM per mile | Local air-quality impact | Relevant near ports, cities, and distribution hubs |
| Empty miles (%) | Deadhead and repositioning miles | Direct waste indicator, high improvement potential |
| Load factor | Capacity utilization | Ties directly to consolidation gains |
Set your reporting boundary before you collect a single data point. Decide whether you are measuring owned fleet only, contracted carriers, or the full multimodal network, and hold that boundary constant across years. The SmartWay Logistics Tool’s technical documentation lays out mode-specific emission factors that make a baseline inventory achievable even for teams without a dedicated sustainability analyst.
How Should Fleets Sequence Electrification and Alternative Fuels?
The most common mistake in fleet transition is buying vehicles before the depot can support them. Electrification is fundamentally a depot and grid project with a vehicle attached, not the other way around.
- Pilot return-to-base routes first. Predictable, short-haul lanes where trucks return to the same depot nightly are the easiest fit for battery electric vehicles, since charging infrastructure needs are simpler to plan.
- Plan depot energy before ordering vehicles. Utility interconnection timelines, transformer capacity, and charger installation frequently take longer than vehicle delivery. DOE guidance on fleet electrification warns that skipping this step risks stranded vehicle assets sitting idle for lack of power.
- Match powertrain to duty cycle. Battery electric fits short, predictable routes; hydrogen fuel cells and renewable fuels suit longer-haul or heavier-duty applications where charging time and range are limiting factors; hybrids can bridge gaps during a multi-year transition.
- Factor total cost of ownership, not sticker price. Fuel and maintenance savings over the vehicle’s life often close the gap with diesel, and federal and state incentive programs tied to national decarbonization corridor strategies can offset a meaningful share of upfront capital.
Pro Tip: Before requesting capital for a single electric truck, get your depot’s utility interconnection study started. That process alone can take longer than the vehicle order, and starting it late is the single most common cause of delayed electrification timelines.
How Can Data Sharing Reduce Empty Miles?
Individual companies rarely have enough visibility into freight flows to solve consolidation and empty-mile problems alone. Coordination across the network is where the bigger gains hide.
- Cross-industry data sharing. USDOT’s FLOW program combines anonymized purchase-order and throughput data across participating companies, giving members network-level visibility that no single shipper could build on their own.
- Appointment management and cross-dock timing. Coordinating delivery appointments across carriers reduces dwell time at docks, which in turn reduces idling and repositioning miles.
- Procurement levers. Building emissions performance into carrier scorecards, alongside cost and on-time metrics, gives carriers a direct incentive to improve without forcing shippers to accept worse service.
- Dashboards for consolidation opportunities. Surfacing empty-mile and load-factor data by lane, updated weekly rather than quarterly, turns consolidation from a periodic project into an ongoing discipline. Better shipment visibility tools make this kind of near-real-time tracking realistic for mid-sized operations, not just large enterprise shippers.
What Does a Realistic Implementation Roadmap Look Like?
Skipping steps in this sequence is the most common reason eco-friendly logistics initiatives stall after a promising pilot. Each stage has a decision gate that protects service and cost before you scale.
- Baseline. Collect activity data (miles, fuel, load factor, facility energy use) and build an inventory using SmartWay or GHG Protocol boundaries.
- Set targets. Establish lane- or facility-level targets rather than one company-wide number; a 500-mile regional lane and a cross-country lane need different benchmarks.
- Pilot. Run time-boxed trials, ideally 90 days, on two comparable lanes, one changed and one held as a control, measuring service level, cost, and emissions intensity together.
- Verify. Confirm results against the same methodology used in the baseline. If service dropped even slightly, treat that as a fail, not a rounding error.
- Scale. Roll out through procurement contracts and governance structures, with continuous monitoring rather than a one-time report.
| Roadmap stage | Primary KPI to watch |
|---|---|
| Baseline | Grams CO2 per ton-mile (starting point) |
| Targets | Lane-specific reduction goal |
| Pilot | Cost per shipment, service level, empty miles |
| Verify | Consistency against baseline methodology |
| Scale | Ongoing emissions intensity trend |
What Are the Biggest Barriers to Going Green?
Capital cost tops the list, followed closely by grid capacity constraints for electrification and lease friction when a warehouse’s efficiency upgrades require landlord sign-off. Operational complexity, retraining dispatch teams, adjusting routing software, and renegotiating carrier contracts, adds friction that pure technology costs don’t capture.
A few mitigations show up repeatedly in successful programs:
- Stage capital investment in phases tied to pilot results, rather than committing to a full fleet or facility overhaul upfront.
- Pursue utility rebates and tenant improvement allowances before assuming a project needs full self-funding.
- Split warehouse retrofit costs with landlords when the lease structure allows shared capital improvements.
- Investigate federal, state, and port-authority grant programs tied to national freight decarbonization goals before ruling out electrification on cost alone.
On outsourcing versus building internal capability: complex customs, multimodal routing, or cross-border compliance work generally benefits from specialized partners, while route optimization and data collection are worth building in-house since they touch daily operations directly.
What Do Logistics Teams Actually Get Wrong Here?
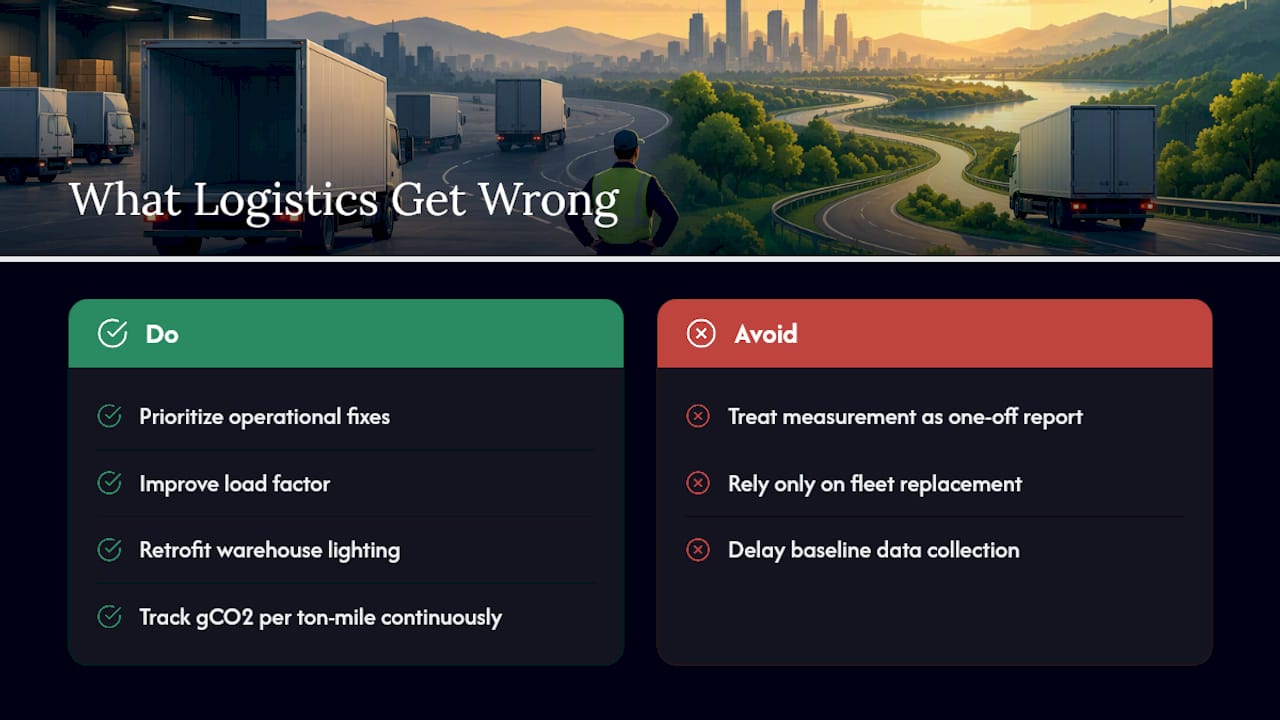
Most clients approach eco-friendly logistics as a single big initiative, usually a fleet switch, when the fastest wins come from boring operational fixes: fixing empty miles, tightening load factor, and retrofitting warehouse lighting. Those don’t make headlines, but they show up on the P&L within a quarter.
The recurring pitfall is treating measurement as a one-time report instead of an ongoing operational habit. Companies that succeed track grams CO2 per ton-mile the same way they track on-time delivery, continuously, not annually. Before committing capital to any tactic in this guide, get your baseline data right. Everything downstream depends on it.
— Ian
How Worldwideexpress Supports Your Sustainability Roadmap
Every stage of the roadmap above, baseline, pilot, verify, scale, runs faster with a logistics partner that already has the infrastructure in place instead of building it from scratch. Worldwideexpress gives supply chain teams a practical way to act on consolidation and modal-shift opportunities without adding headcount or waiting on a technology rollout.
For teams working through their baseline inventory, International Logistics Services covers the freight forwarding, trucking, and ocean and air transportation needed to test consolidation and modal-shift pilots on real lanes. Ocean transportation, including FCL and LCL ocean freight, gives teams a lower-emissions-per-ton-mile option worth testing against current truck-only lanes. Import-heavy operations evaluating where freight consolidation could reduce empty container moves can start with Import Freight Services, while U.S. Customs Brokerage keeps compliance from becoming the bottleneck once a pilot moves toward scale. If your next step is comparing lane costs before committing budget to a pilot, request a freight quote and get the numbers in front of your team this week.
Sources
- FLOW program | U.S. Department of Transportation
- 2024 SmartWay Online Logistics Tool: Technical Documentation U.S. Version 1.0 (Data Year 2023)
- Prologis retrofit case study (DOE Better Buildings)
FAQ
What Is Eco-Friendly Logistics?
Eco-friendly logistics is the practice of managing transportation, warehousing, packaging, and reverse logistics to reduce carbon and pollutant intensity while maintaining cost and service performance. It typically involves route optimization, load consolidation, cleaner power sources, and standardized emissions measurement using frameworks like SmartWay and GLEC.
What Is the Meaning of Eco-Logistics?
Eco-logistics refers to the same core concept as eco-friendly logistics: designing supply chain and freight operations to lower environmental impact, covering both climate metrics like CO2 and local air-quality metrics like NOx and particulate matter. The term is used interchangeably across industry reporting.
What Is an Example of Green Logistics?
A common example is load consolidation combined with route optimization, which reduces the number of trucks needed and cuts empty miles on a given lane. Another is a warehouse lighting and controls retrofit; one documented DOE case study at a Prologis facility cut electricity use by 41%.
How Do You Measure Progress in Eco-Friendly Logistics?
Track grams of CO2 per ton-mile alongside NOx and particulate matter per mile, empty-mile percentage, and load factor, using a consistent reporting boundary from year to year. The SmartWay Logistics Tool provides the emission factors needed to build this baseline.
Does Worldwideexpress Offer Eco-Friendly Logistics Support?
Worldwideexpress supports lower-impact logistics through consolidation-friendly ocean and air transportation options, customs brokerage that keeps compliance from slowing down pilots, and freight forwarding services suited to testing modal-shift opportunities. Current service pricing is available by requesting a freight quote directly from the site.