You probably think your base ocean freight rate covers your shipping costs. It doesn’t. Surcharges, fees, and market volatility in 2026 can double what you expected to pay per container. This guide breaks down every charge component, explains market forces raising costs on U.S. trade lanes, and delivers negotiation strategies to control your freight expenses.
Table of Contents
- Introduction To Ocean Freight Charges
- Market Dynamics Driving Ocean Freight Charges In 2026
- Breaking Down Ocean Freight Charge Components
- Common Misconceptions About Ocean Freight Charges
- Negotiating And Managing Ocean Freight Charges Effectively
- Customs Compliance And Tariff Impact On Freight Charges
- Strategic Approaches To Ocean Freight Cost Management In 2026
- Summary And Best Practices For U.S. Importers And Exporters
- Optimize Your Ocean Freight With Worldwide Express Services
- Frequently Asked Questions
Key takeaways
| Point | Details |
|---|---|
| Ocean freight charges include base rates plus multiple surcharges and fees | Bunker, currency, and environmental surcharges often equal or exceed the base rate you negotiate with carriers. |
| Capacity constraints on major U.S. trade lanes keep freight rates volatile in 2026 | 5% global container fleet expansion primarily aids secondary routes, leaving Asia-US lanes tight. |
| Geopolitical disruptions add significant cost and transit delays | Suez Canal closure forces 95% of ships to reroute via Cape of Good Hope, adding 10-14 days. |
| Contract negotiation and volume commitments help manage shipping cost volatility | Minimum volume agreements unlock discounts and stabilize pricing amid rate swings. |
| Tariffs and customs compliance increase total landed cost beyond freight charges | U.S. tariff regulations add duties and fees factored into landed cost calculations. |
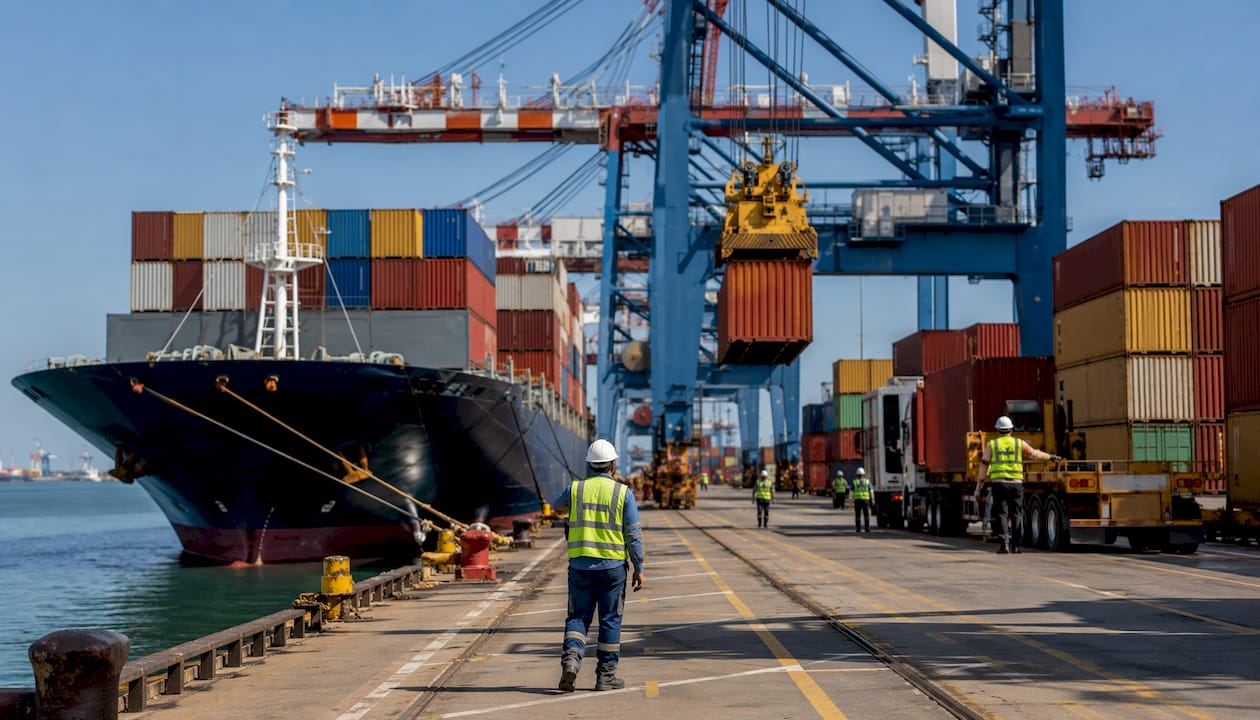
Introduction to ocean freight charges
The base ocean freight rate is the primary cost you negotiate with a carrier to move your container from port to port. This rate represents only part of your total expense. Carriers apply surcharges that fluctuate independently based on fuel prices, currency exchange, environmental regulations, and market conditions.
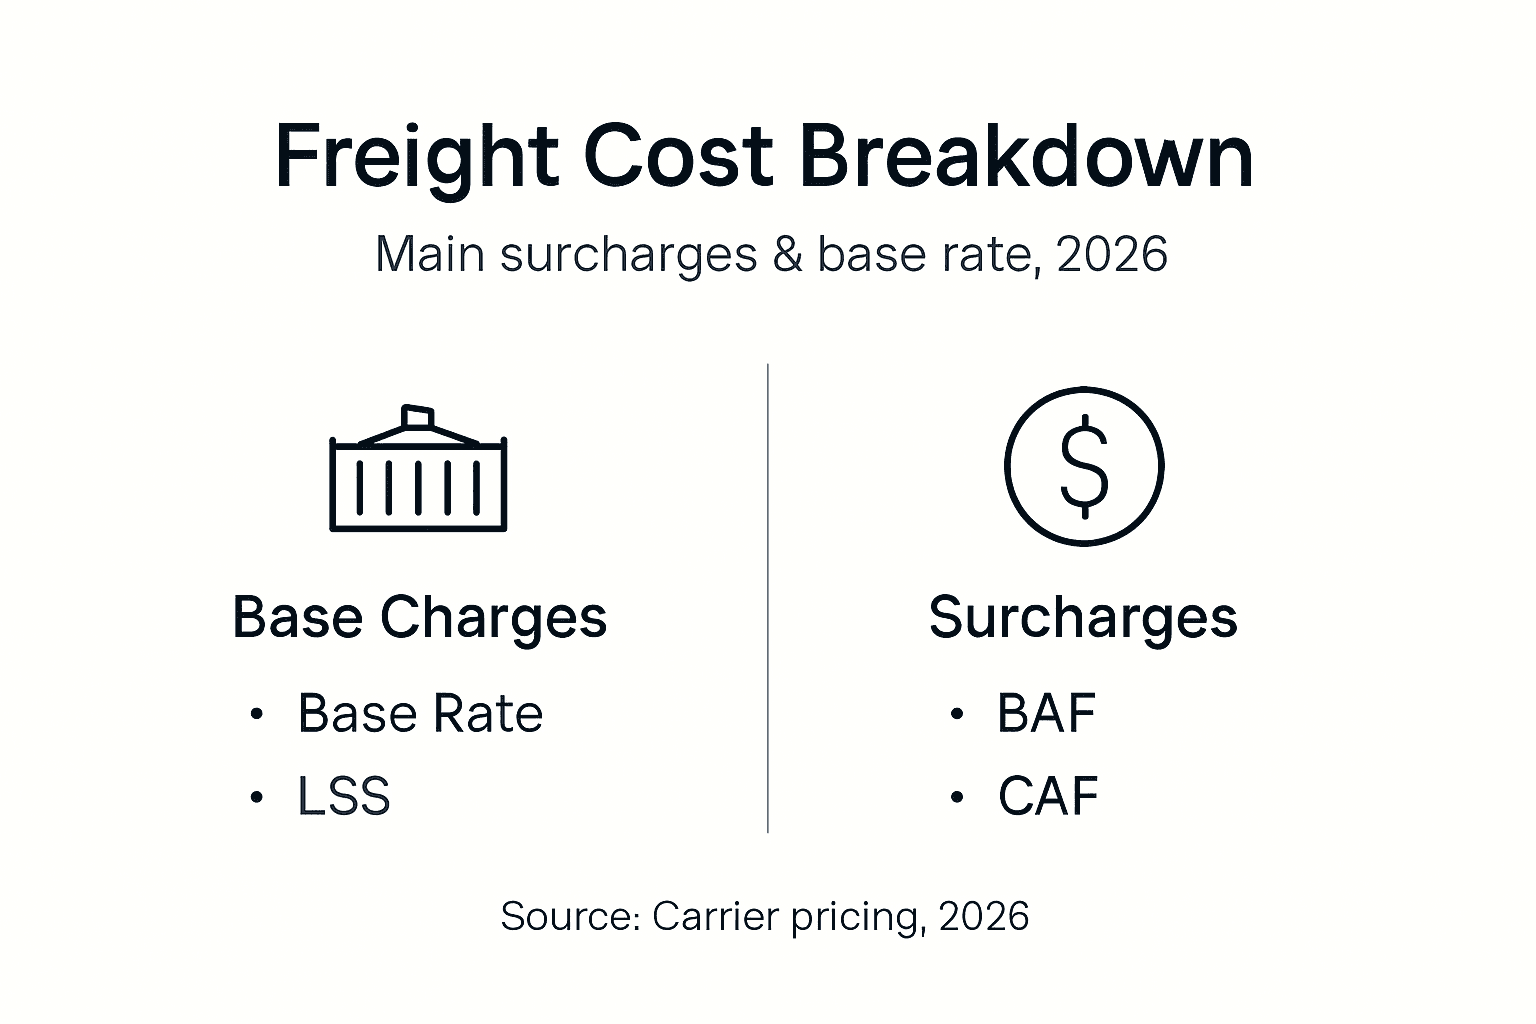
Common surcharges include the Bunker Adjustment Factor (BAF) covering fuel cost variations, the Currency Adjustment Factor (CAF) compensating for exchange rate shifts, the Low Sulfur Surcharge (LSS) for cleaner fuel mandates, and General Rate Increases (GRI) carriers impose periodically to adjust base pricing. These surcharges can add hundreds to thousands of dollars per container depending on trade lane and timing.
Beyond surcharges, you face documentation fees for bill of lading and customs paperwork, terminal handling charges at origin and destination ports, chassis and drayage fees for inland transport, and insurance premiums protecting cargo value. Each fee appears separately on invoices, making it essential to request itemized breakdowns from carriers and freight forwarders.
Surcharges fluctuate independently because they tie to external market variables like crude oil prices or currency markets that shift daily. Your base rate might stay fixed under a contract, but surcharges adjust monthly or quarterly based on published indexes. This independence means your total freight charge varies even when your base rate remains stable.
For example, a negotiated base rate of $2,000 from Shanghai to Los Angeles might carry $800 in BAF, $200 in CAF, $150 in LSS, and $300 in terminal and documentation fees, bringing your actual cost to $3,450 per container. Understanding this breakdown prevents budget surprises and enables you to lower international container shipping rates through informed negotiations.
Key surcharge categories you must track:
- Fuel surcharges (BAF) tied to bunker fuel price indexes updated monthly
- Currency adjustments (CAF) reflecting exchange rate movements between contract currency and local currencies
- Environmental compliance fees (LSS) for low sulfur fuel mandates and emission regulations
- Peak season surcharges during high demand periods like pre-holiday shipping windows
- Port congestion charges when terminals face delays or capacity bottlenecks
- Documentation and administrative fees for customs filings and bill of lading processing
Market dynamics driving ocean freight charges in 2026
Capacity allocation decisions by carriers directly affect your freight rates. The global ocean container fleet increased by 5% in capacity in 2026 with over 1.4 million TEU of new vessels, but 70-80% of this capacity is directed toward secondary trade routes, leaving major Asia-US lanes still capacity constrained. This imbalance keeps rates elevated on the routes U.S. importers rely on most.
Carriers actively manage supply through blank sailings, where scheduled voyages are canceled to prevent overcapacity from depressing rates. Ocean carriers actively use blank sailings (up to 10% of scheduled sailings canceled) and service restructuring like hub-and-spoke models to manage capacity and stabilize freight rates, impacting availability and pricing unpredictably for shippers in 2026. When your booked sailing gets blanked, you face delays and potential rate increases on alternative departures.
Geopolitical events create the most dramatic cost shocks. In 2026, ongoing geopolitical risks such as the closure and potential reopening of the Suez Canal compel nearly 95% of ships to reroute around the Cape of Good Hope, adding 10-14 days to transit times and increasing ocean freight costs significantly through higher fuel consumption and opportunity costs from slower asset turnover.
Trade lane demand intensity drives rate volatility. Routes serving high-volume manufacturing hubs in Asia to U.S. consumption markets experience persistent equipment shortages and premium pricing. Backhaul routes from U.S. to Asia often carry lower rates due to imbalanced trade flows, but you still pay elevated charges on your import legs.
Tariff policies add another layer of unpredictability. Changes in 2026 global shipping tariff volatility prompt importers to shift sourcing locations or accelerate shipments ahead of duty increases, creating demand spikes that push freight rates higher temporarily. Carriers capitalize on these rushes by raising spot rates or applying emergency surcharges.
Key market forces affecting your freight costs:
- Capacity constraints on major trade lanes despite overall fleet growth
- Blank sailings reducing available space and increasing rate pressure
- Geopolitical rerouting adding transit time and fuel costs
- Demand surges from tariff changes or peak seasons
- Hub-and-spoke network restructuring creating indirect routing and transshipment delays
- Carrier consolidation reducing competition on key routes
Breaking down ocean freight charge components
Calculating your total freight charge requires summing the base rate plus every applicable surcharge and fee. The Bunker Adjustment Factor (BAF) typically represents the largest variable cost, recalculated monthly based on global fuel price indexes published by organizations like the World Fuel Index. When crude oil prices rise, your BAF increases proportionally, sometimes adding 30-40% to your base rate.

Currency Adjustment Factor (CAF) protects carriers from exchange rate losses when your contract currency differs from their operating currencies. If the U.S. dollar weakens against Asian currencies, carriers apply CAF to maintain profit margins. This surcharge usually ranges from 2-8% of the base rate depending on currency volatility.
Low Sulfur Surcharge (LSS) covers the cost premium of International Maritime Organization compliant low sulfur fuels mandated to reduce emissions. Carriers pass this environmental compliance cost directly to shippers, adding $100-$300 per container depending on voyage length and fuel consumption.
General Rate Increases (GRI) are periodic adjustments carriers announce to raise base rate levels across entire trade lanes. Carriers typically issue GRIs quarterly or when market conditions allow, increasing rates by $200-$1,000 per container. Even if you hold a contract, GRI clauses often permit these increases with 30-60 days notice.
Pro Tip: Monitor the Singapore Fuel Oil 380 CST price index and major currency pair movements monthly. When you see fuel prices climbing or dollar weakening, expect BAF and CAF increases within 4-6 weeks, allowing you to adjust budgets or accelerate bookings before surcharges rise.
| Trade Lane | Base Rate ($/FEU) | BAF ($/FEU) | CAF ($/FEU) | LSS ($/FEU) | Total Est. ($/FEU) |
|---|---|---|---|---|---|
| Shanghai to LA | $2,200 | $750 | $180 | $220 | $3,350 |
| Shanghai to NY | $3,800 | $950 | $240 | $280 | $5,270 |
| Hamburg to NY | $1,600 | $420 | $110 | $160 | $2,290 |
| Southeast Asia to LA | $1,900 | $680 | $150 | $200 | $2,930 |
Seasonal patterns significantly affect costs. Peak shipping season from August through October before the holiday retail period sees rate increases of 25-50% as importers compete for limited space. Chinese New Year factory shutdowns in January and February create capacity surplus and lower rates temporarily. Understanding these cycles helps you time shipments to capture favorable pricing windows.
Key charge components requiring budget planning:
- Base freight rate negotiated with carrier or quoted on spot market
- Bunker surcharge tied to fuel price indexes
- Currency adjustments reflecting exchange rate movements
- Environmental compliance surcharges for low sulfur fuel
- Peak season premiums during high demand periods
- Terminal handling charges at origin and destination
- Documentation and customs filing fees
- Equipment detention charges if containers held beyond free time
Common misconceptions about ocean freight charges
Many importers assume the rate quoted by a carrier represents their total shipping cost. This belief leads to severe budget overruns when invoices arrive with surcharges doubling the expected amount. Always request all-in pricing that itemizes every surcharge and fee, or budget 80-100% above quoted base rates to absorb typical add-ons.
Shippers with service contracts often think rates stay fixed throughout the contract term. Contracts include adjustment clauses permitting surcharge changes, GRIs, and emergency fees when market conditions shift dramatically. Read your contract terms carefully to identify which charges can fluctuate and under what conditions carriers may impose increases.
Another misconception treats freight quote factors as purely transportation costs, ignoring how tariffs and customs duties dramatically increase total landed cost. U.S. tariff rates vary from 0% to over 25% depending on product classification and country of origin, potentially adding thousands of dollars per container in duties separate from freight charges.
Some shippers assume all invoice charges are legitimate and never audit carrier bills. Billing errors occur frequently, including duplicate surcharges, incorrect weight or volume classifications, and fees for services not rendered. Regular invoice audits can recover 3-8% of freight spend annually by identifying and disputing erroneous charges.
Importers sometimes believe negotiating lower base rates automatically reduces total costs. If your negotiated rate cut comes with higher surcharge percentages or stricter minimum volume commitments you cannot meet, your actual spend may increase. Evaluate total cost scenarios including likely surcharge levels and commitment penalties before signing contracts.
Pro Tip: Request monthly surcharge schedules from your carriers and freight forwarders showing upcoming BAF, CAF, and other adjustment rates. Compare these against your contract terms to verify calculations and catch billing errors before paying invoices.
Common pitfalls to avoid:
- Confusing base rate quotes with total all-in freight charges
- Assuming contract rates remain fixed despite market volatility
- Ignoring tariff duties and customs fees in landed cost calculations
- Accepting carrier invoices without auditing for errors or duplicate charges
- Overlooking hidden brokerage and freight fees embedded in service agreements
- Believing all surcharges are mandatory when some may be negotiable
- Failing to track common freight forwarding myths that inflate costs unnecessarily
Negotiating and managing ocean freight charges effectively
Spot market rates offer maximum flexibility, allowing you to book individual shipments without volume commitments. Rates fluctuate daily based on supply and demand, providing opportunities to capture low pricing when capacity exceeds demand but exposing you to severe spikes during tight markets. Spot rates work best for irregular shipment patterns or when testing new trade lanes.
Contract rates deliver price stability and priority space allocation in exchange for minimum volume commitments over 6-12 month terms. Contracts protect against spot market spikes but lock you into rates that may exceed market levels if capacity loosens. Most contracts include adjustment clauses permitting surcharge changes and periodic GRIs, limiting true price protection.
A hybrid approach combines contracted volumes for predictable baseline needs with spot bookings for overflow or opportunistic purchases when rates dip. This strategy balances cost stability with flexibility, allowing you to meet commitments while capturing market efficiencies. Allocate 60-70% of expected volume to contracts and reserve 30-40% for spot market optimization.
- Consolidate volumes across business units or product categories to increase your negotiating leverage with carriers, unlocking volume tier discounts of 10-25%.
- Compare quotes from multiple carriers and NVOCCs (non-vessel operating common carriers) to establish competitive benchmarks before entering freight rate negotiation discussions.
- Request contract terms with cap and collar provisions limiting surcharge increases to defined ranges, protecting against extreme market swings.
- Negotiate free detention and demurrage periods extended beyond standard terms to reduce penalty charges for container delays at your facilities.
- Work with freight forwarders who consolidate volumes across multiple shippers to access better rates than you could negotiate independently, as explained in cut shipping costs with freight forwarders.
Timing negotiations strategically improves outcomes. Carriers seek volume commitments in November and December to fill capacity allocations for the coming year. Negotiating during this window when carriers compete aggressively for market share often yields better rates and terms than mid-year renewals.
Volume commitments must balance discount benefits against penalties for unmet minimums. Carefully forecast your shipment volumes using historical data and growth projections, then commit to 80-85% of expected volume to build cushion for demand fluctuations while still qualifying for meaningful discounts.
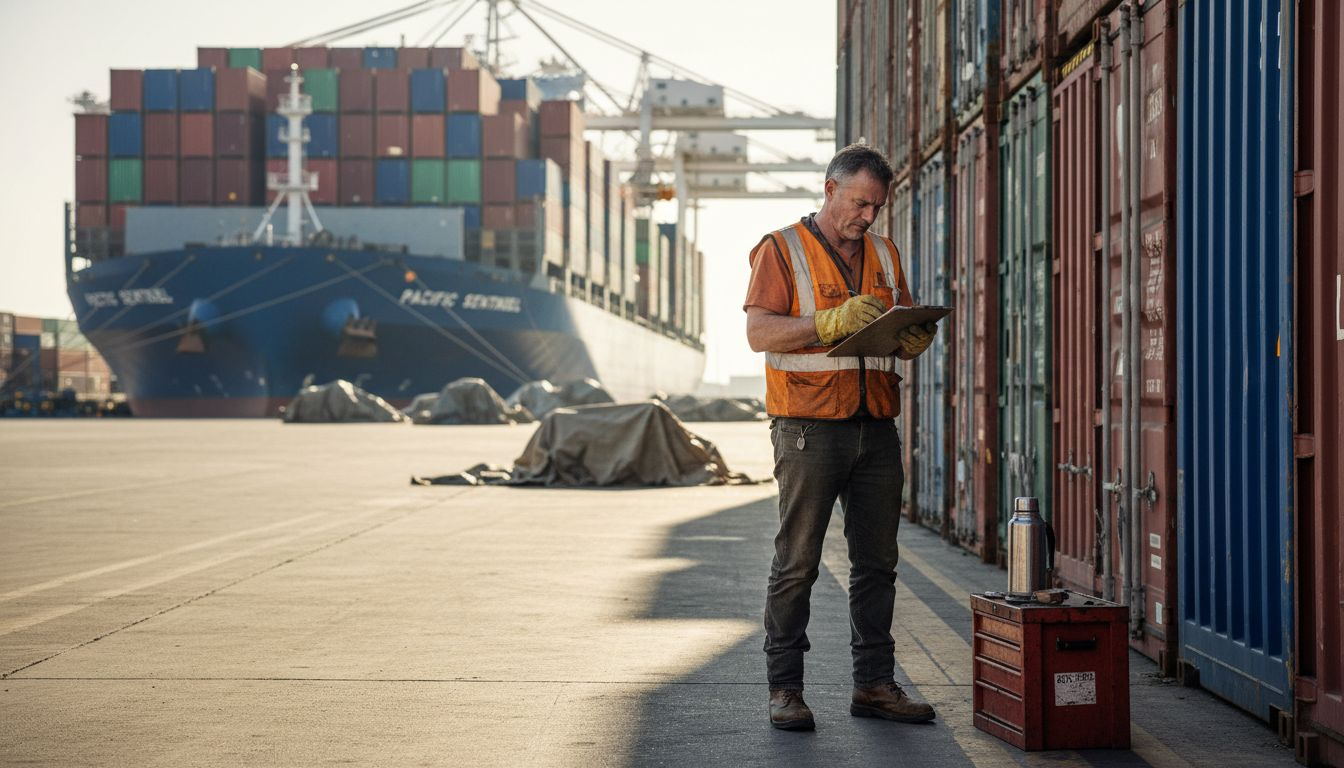
Customs compliance and tariff impact on freight charges
U.S. tariff regulations add duties and compliance fees factored into landed cost calculations beyond ocean freight charges. Import duties range from zero under free trade agreements to over 25% on products subject to Section 301 tariffs or anti-dumping measures. These duties apply to the declared customs value of goods, potentially adding thousands per container.
Customs compliance processes affect your freight timeline and costs through documentation requirements, inspections, and clearance delays. Incomplete or inaccurate paperwork triggers examinations that incur storage fees at ports while containers await release. Proper classification under Harmonized Tariff Schedule codes determines duty rates, making classification errors costly through overpayment or penalty assessments.
Customs brokers manage documentation, duty calculations, and regulatory compliance to expedite clearance and minimize charges. Licensed brokers understand tariff classifications, trade agreements, and customs regulations that reduce duty expenses legally through programs like duty drawback or foreign trade zones. Their expertise prevents costly errors and accelerates cargo release from ports.
Freight forwarders often provide integrated customs brokerage services, coordinating ocean transport and import clearance seamlessly. This integration reduces communication delays and ensures documentation accuracy between shipping and customs processes. Using a single provider for both services typically costs less than managing separate freight and brokerage vendors.
Compliance failures create financial penalties beyond initial duty assessments. U.S. Customs and Border Protection can impose fines for misclassification, undervaluation, or prohibited imports ranging from duty value adjustments to criminal penalties for intentional fraud. Invest in proper compliance systems and expert guidance to avoid these risks.
Added cost layers and best practices:
- Import duties based on Harmonized Tariff Schedule classification of products
- Merchandise Processing Fee (0.3464% of customs value, minimum $27.75, maximum $538.40 per entry)
- Harbor Maintenance Fee (0.125% of cargo value for ocean shipments)
- Customs broker service fees for clearance processing and compliance
- Storage and demurrage charges if clearance delays prevent timely cargo pickup
- Ensure accurate product classification using qualified customs brokers
- Maintain complete documentation including commercial invoices, packing lists, and certificates of origin
- Calculate total landed cost including freight, duties, and fees before purchase decisions
- Explore duty reduction programs like foreign trade zones or drawback refunds for eligible imports
Strategic approaches to ocean freight cost management in 2026
Choosing the right booking strategy requires evaluating your volume predictability, risk tolerance, and cash flow constraints against market conditions.
| Strategy | Pros | Cons | Best For |
|---|---|---|---|
| Contract Only | Price stability, guaranteed space allocation, volume discounts | Locked into rates during market dips, minimum volume penalties, limited flexibility | Predictable high-volume shippers needing cost certainty |
| Spot Only | Maximum flexibility, capture market lows, no volume commitments | Extreme rate volatility, space availability risk during peaks, budget uncertainty | Irregular shippers or those with highly variable demand |
| Hybrid (60/40 mix) | Balanced stability and flexibility, optimize rates opportunistically, reduce commitment risk | Requires active market monitoring, managing multiple contracts, coordination complexity | Most importers seeking cost control with adaptability |
Adapting routing in response to geopolitical events and capacity constraints can reduce costs and improve reliability. When Suez Canal closures force rerouting, evaluate whether alternative origin ports in Southeast Asia with less affected routes offer competitive total costs including inland freight to factories. Trans-Pacific direct services may cost more per ocean leg but eliminate transshipment delays and fees.
Combining contracts with spot purchases allows you to lock favorable rates when market conditions permit while maintaining baseline capacity access. For example, contract 65% of annual volume at negotiated rates, then book remaining 35% on spot market when rates drop below contract levels or demand fluctuates unexpectedly.
Example: A U.S. importer contracting 100 FEU monthly at $3,200 from Shanghai to Los Angeles saves $400 per container versus average spot rates. When spot rates temporarily drop to $2,600 during off-peak periods, booking additional 30 FEU spot purchases captures $600 per container savings on incremental volume, optimizing total freight spend while maintaining contracted baseline capacity.
Best practices for 2026 freight cost risk management:
- Diversify carrier relationships across 2-3 providers to reduce dependency and increase negotiation leverage
- Monitor capacity indicators like blank sailing announcements and equipment availability to anticipate rate movements
- Build flexible lead times into procurement schedules allowing earlier or delayed shipments to avoid peak rate periods
- Establish contingency routing plans identifying alternative ports and transit modes when primary lanes face disruptions
- Review and audit freight invoices monthly to identify billing errors and track actual costs against budgets
- Maintain open communication with freight forwarders and carriers to receive advance notice of market changes and surcharge adjustments
- Explore 2026 international logistics trends to anticipate structural shifts affecting long-term freight strategies
Summary and best practices for U.S. importers and exporters
Ocean freight charges in 2026 consist of negotiated base rates plus variable surcharges for fuel, currency, environmental compliance, and market conditions that often equal or exceed base costs. Market dynamics including 5% fleet capacity growth directed mostly to secondary routes, up to 10% blank sailings reducing available space, and geopolitical disruptions adding 10-14 days transit time drive persistent volatility on major U.S. trade lanes.
Effective negotiation requires consolidating volumes, comparing competitive quotes, requesting surcharge caps, and working with freight forwarders who access better rates through aggregated shipper volumes. Hybrid booking strategies combining contracted baseline capacity with opportunistic spot purchases balance cost stability against market optimization.
Tariff duties and customs compliance add significant costs beyond freight charges, requiring accurate product classification, complete documentation, and expert brokerage services to minimize duties and avoid penalties. Total landed cost calculations must include ocean freight, surcharges, duties, and clearance fees for accurate budgeting and sourcing decisions.
Top best practices for controlling ocean freight costs:
- Demand transparent all-in pricing showing base rates plus itemized surcharges and fees from all carriers and forwarders
- Monitor fuel price indexes, currency movements, and capacity indicators monthly to anticipate surcharge changes and rate trends
- Audit freight invoices regularly to catch billing errors, duplicate charges, and unauthorized fees
- Leverage freight forwarder expertise and volume aggregation to access better rates and navigate compliance requirements
- Maintain flexible booking strategies combining contracts for stability with spot market opportunities for cost optimization
- Build contingency plans for alternative routing and carriers to manage disruptions and capacity shortages
Optimize your ocean freight with Worldwide Express services
Managing volatile ocean freight charges in 2026 requires specialized market knowledge and carrier relationships that most importers lack in-house. Worldwide Express delivers expert ocean freight forwarding tailored to current market dynamics, leveraging our global carrier network to secure competitive rates and reliable space allocation even during capacity crunches.
Our customs brokerage services eliminate compliance risks and hidden charges by ensuring accurate documentation, proper tariff classification, and efficient clearance processes. We handle the complexity of U.S. customs regulations so your cargo moves smoothly from port to door without costly delays or penalty assessments. Compare our comprehensive approach in best freight forwarding services to see how integrated solutions reduce total landed costs.
Contact Worldwide Express today for a customized freight cost analysis and discover how our U.S. customs brokerage services can optimize your international shipping expenses while improving delivery reliability.
Frequently asked questions
What are the biggest surcharges affecting ocean freight costs?
Fuel-related Bunker Adjustment Factor (BAF) and currency adjustment fees are typically the largest surcharges impacting final shipping cost. BAF alone often adds 30-40% to base rates depending on fuel price levels. Environmental compliance surcharges for low sulfur fuel and peak season premiums during high demand periods also contribute significantly to total freight charges.
How does the Suez Canal closure impact U.S. ocean freight charges?
Rerouting ships via the Cape of Good Hope adds 10-14 days of transit and increases fuel and operational costs, raising freight charges significantly. Longer voyages reduce vessel productivity, requiring carriers to deploy more ships to maintain service frequency, costs they pass to shippers through higher rates and emergency surcharges. This disruption particularly affects Asia to U.S. East Coast routes that previously transited Suez.
Should I choose contract or spot rates for ocean freight?
Contract rates offer better price stability with minimum volume commitments, ideal for steady shipping needs and budget certainty. Spot rates provide flexibility but can be costly and volatile, suited for fluctuating demand or testing new suppliers. A hybrid approach allocating 60-70% to contracts and 30-40% to spot bookings balances cost stability with market optimization, letting you capture rate dips while maintaining guaranteed capacity access.
Can tariffs increase ocean freight charges directly?
Tariffs do not usually alter base freight rates but add duties and fees increasing total landed cost significantly. Import duties under U.S. customs regulations range from zero to over 25% of declared cargo value, potentially adding thousands per container. They impact documentation requirements and compliance fees, indirectly influencing shipping expenses through customs broker charges and potential delay costs from increased scrutiny of tariff-sensitive products.
Recommended
- Global Shipping 2026: 72% Face Tariff Volatility – Worldwide Express, Inc.
- Carrier vs Freight Forwarder: Cut 20% Shipping Costs 2026 – Worldwide Express, Inc.
- 8 Key Freight Quote Factors Every Shipper Should Know – Worldwide Express, Inc.
- 7 Proven Ways to Lower International Container Shipping Rates – Worldwide Express, Inc.
- Brokerage Account Fees: Decode Hidden Costs & Spreads – Olla Trade
- Complete Guide to Lisbon Boat Capacity Planning